S&P500 Daily Action Areas & Price Targets 5/8/26

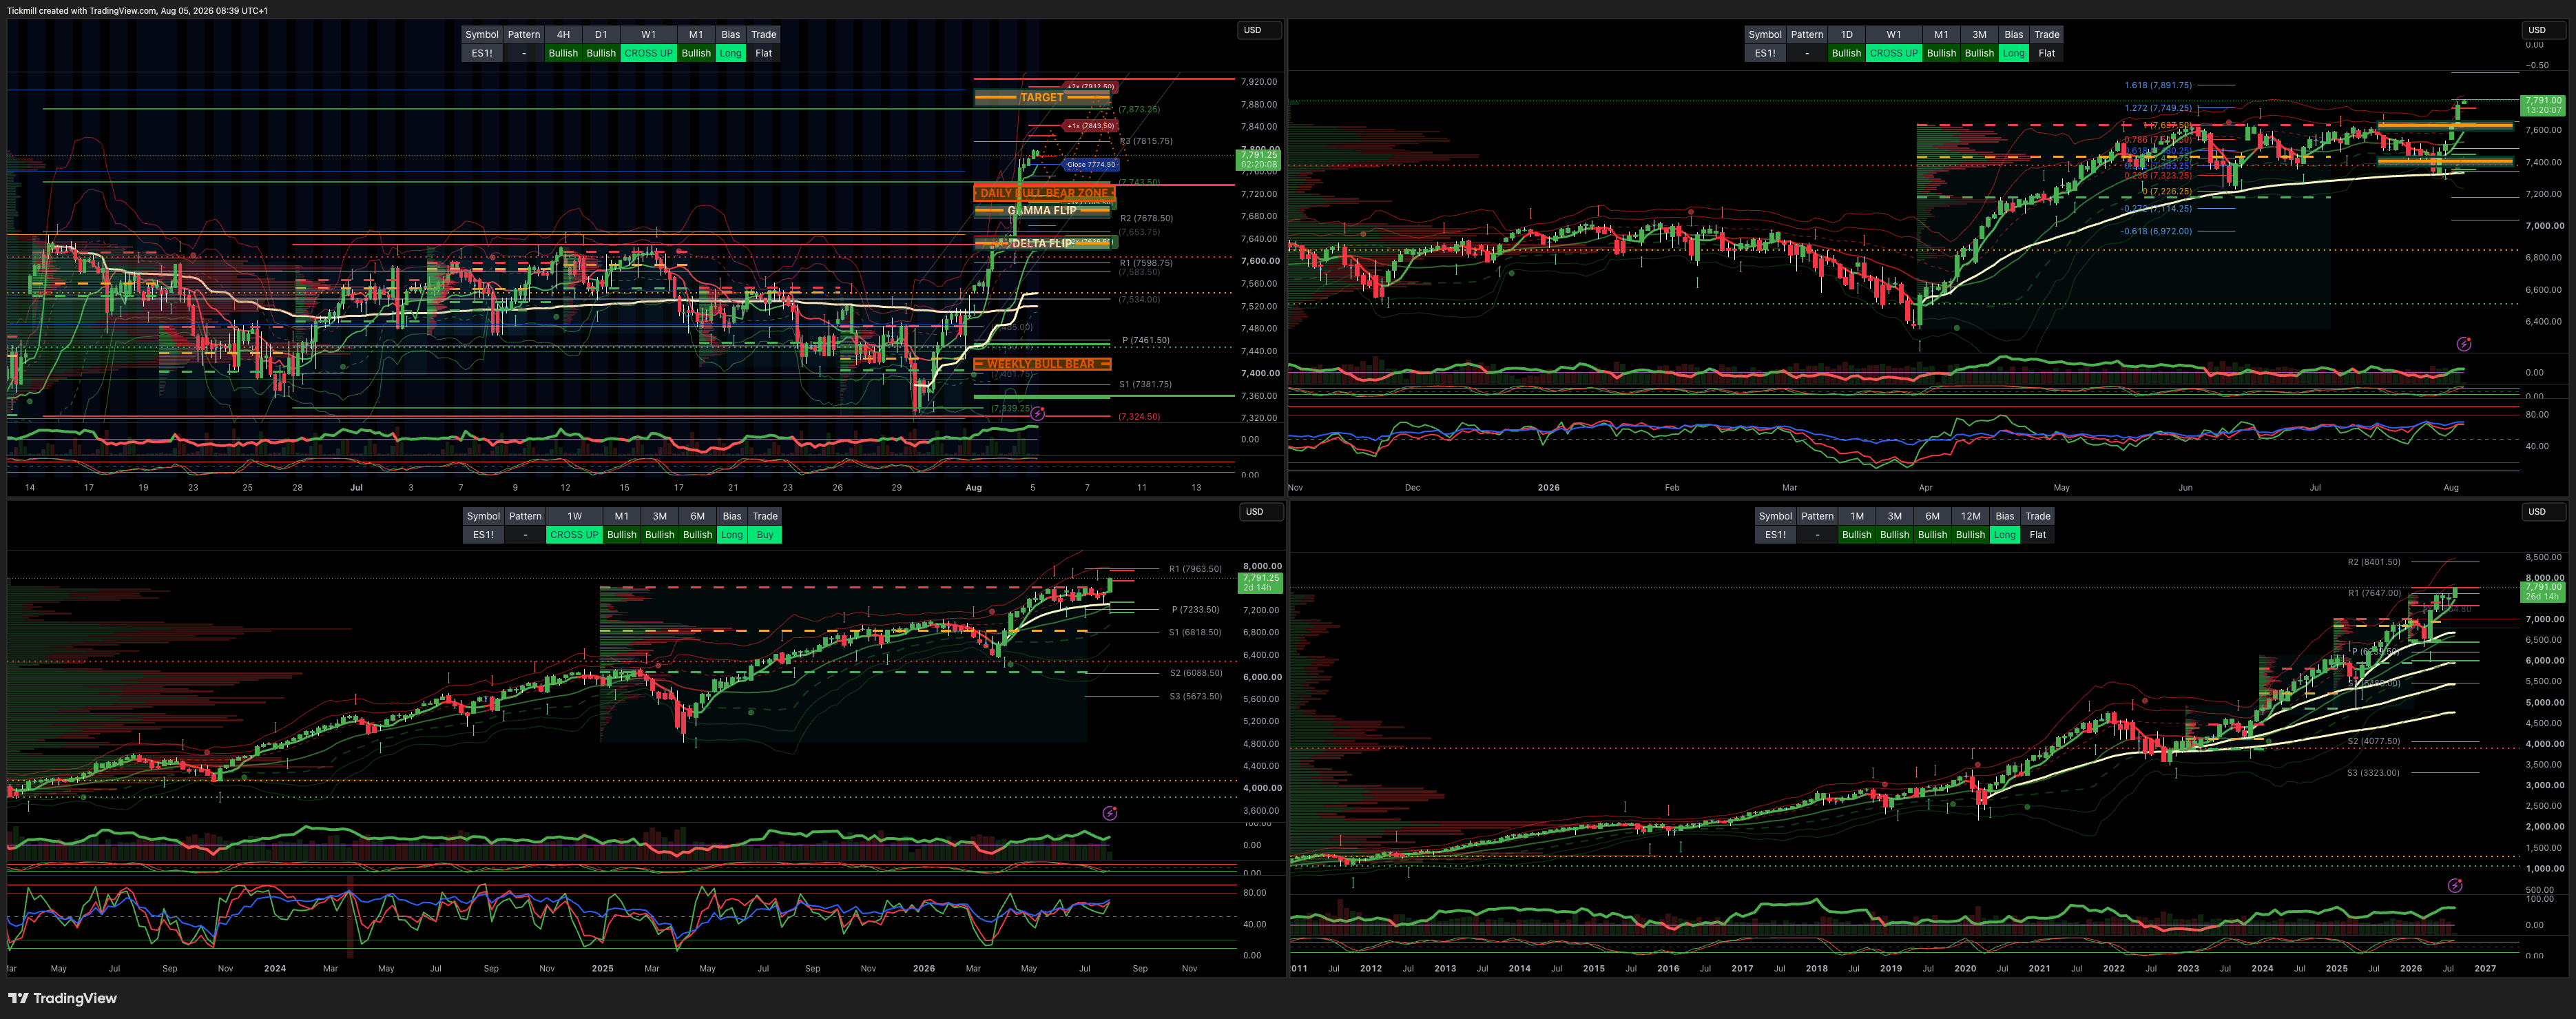
S&P500 Daily Action Areas & Price Targets 5/8/26
***QUOTING ES1! FOR CASH US500 EQUIVALENT LEVELS, SUBTRACT POINT DIFFERENCE***
WEEKLY BULL BEAR ZONE 7400/20
WEEKLY RANGE RES 7635 SUP 7410
MONTHLY RANGE RES 7838 SUP 7258
JHEQX Q3 Collar Short Call Cap: ~7,750 – 7,900 - Long Put Strike: ~7,050 – 7,100 (approx. 5% downside protection) Short Put Strike: ~5,950
DEC2025 OPEX to DEC2026 OPEX is 945 points giving us a range of [5889,7779]
SPX PUT/CALL RATIO 0.84 (The numbers reflect options traded during the current session.) A put-call ratio below 0.7 is generally considered bullish, and a put-call ratio above 1.0 is generally considered bearish.
GS Flow Desk: large S&P 31Aug 7000/7950 strangle in roughly $20mm vega / $115mm premium …My Read – classic “big convexity versus carry” trade: either someone paid a lot to own a wide August move, or someone got paid a lot to bet that the S&P stays comfortably inside the 7000–7950 corridor
DAILY VWAP BULLISH 7596
WEEKLY VWAP BEARISH>BULLISH 7522
MONTHLY VWAP BULLISH 7477
DAILY STRUCTURE - OTFH - 7656
WEEKLY STRUCTURE - BALANCE 7648/7247
MONTHLY STRUCTURE - OTFH - 7247
Balance: This refers to a market condition where prices move within a defined range, reflecting uncertainty as participants await further market-generated information. Our approach to balance includes favouring fade trades at the range extremes (highs/lows) while preparing for potential breakout scenarios if the balance shifts.
One-Time Framing Higher (OTFH): This represents a market trend where each successive bar forms a higher low, signalling a strong and consistent upward movement.
One-Time Framing Lower (OTFL): This describes a market trend where each successive bar forms a lower high, indicating a pronounced and steady downward movement.
DAILY BULL BEAR ZONE 7730/20
GAMMA FLIP 7695
DELTA FLIP 7634
DAILY RANGE RES 7843 SUP 7706
2 SIGMA RES 7900 SUP 7629
VIX BULL BEAR ZONE 17.9 (VVIX / VIX) 5.61
TRADES & TARGETS
LONG ON REJECT/RECLAIM DAILY BEAR ZONE TARGET DAILY RANGE RES > AUG RANGE RES 7838
***ADDITIONAL SETUPS & TARGETS HIGHLIGHTED ON THE CHARTS***
(I FADE TESTS OF 2 SIGMA LEVELS ESPECIALLY INTO THE FINAL HOUR OF THE NY CASH SESSION AS 90% OF THE TIME WHEN TESTED THE MARKET WILL CLOSE ABOVE OR BELOW THESE LEVELS)
GOLDMAN SACHS FICC & EQUITY TRADING DESK VIEWS
US Market Close — Record High Reclaim, FOMO Upside Chase, and Cleaner Positioning Give the Rally Legs
US equities delivered a powerful broad-based rally, with the S&P 500 closing at its first record high since June. The S&P rose 179bps to 7,736, the Nasdaq 100 surged 332bps to 29,733, Russell 2000 gained 205bps to 3,042, and the Dow added 171bps to 54,085.
The session was a classic “rising tide lifts all boats” day, led by TMT but broad enough to suggest more than just a narrow squeeze. The combination of stellar Q2 earnings, cleaner positioning, and renewed demand for short-dated upside drove the move. The Nasdaq 100 is now up roughly 9% in just four sessions since last Thursday.
The key message:
The market has moved from forced de-grossing to FOMO re-risking. Cleaner positioning means the index rally has legs, but upside is now being chased through short-dated options, which can amplify moves and increase fragility.
1. Market Snapshot
Asset | Move | Close |
|---|---|---|
S&P 500 | +1.79% | 7,736 |
NDX | +3.32% | 29,733 |
Russell 2000 | +2.05% | 3,042 |
Dow | +1.71% | 54,085 |
VIX | +3.47% | 16.42 |
WTI Crude | -5.81% | US$75.68 |
US 10Y | -5.7bps | 4.6187% |
Gold | +0.61% | US$4,078 |
DXY | -0.01% | 99.89 |
Bitcoin | +0.55% | US$64,090 |
Total consolidated US equity volume was 18.37bn shares, below the YTD daily average of 19.333bn shares. The market-on-close imbalance was large at US$8.7bn to sell, but it did not meaningfully dent the tape.
2. What Changed: From De-Grossing to Re-Risking
The biggest shift is that the market has moved out of the acute phase of forced liquidation.
Goldman Prime data show that overall book gross leverage saw its second-largest monthly decline in the history of the data set last month, behind only July 2025. That is an enormous reset.
This matters because once gross leverage has been cut aggressively, the market becomes less vulnerable to forced selling and more capable of responding positively to fundamentals.
The current rally is being supported by:
Cleaner hedge fund positioning
Strong Q2 earnings
AI / TMT fundamental resilience
Declining crude
Lower 10-year yields
Broad buying by asset managers and hedge funds
Demand for short-dated upside
FOMO after the NDX rebounded sharply
This is the opposite of last week’s tape, when good earnings were being sold because positioning was too crowded.
3. Fundamentals Are Finally Being Rewarded
John Flood’s point is central: strong fundamentals plus cleaner positioning means the move higher at the index level has legs.
During the unwind, the market faded beats because investors were focused on:
AI capex skepticism
crowded longs
rate pressure
margin concerns
factor deleveraging
systematic trigger risk
Now, with positioning cleaner, earnings strength is translating into price action again. That is a healthier tape.
The key difference:
Strong Earnings+Crowded Positioning=Beat-and-FadeStrong Earnings+Crowded Positioning=Beat-and-Fade
But now:
Strong Earnings+Cleaner Positioning=Re-Rating / Re-RiskingStrong Earnings+Cleaner Positioning=Re-Rating / Re-Risking
That is why the S&P could close at a record despite a large MOC sell imbalance.
4. Desk Activity: Net Buying, but Not Yet Full Chase in Cash TMT
The floor activity level was described as 5 out of 10, which is important. This was not an extreme all-in cash chase session.
Flows:
Asset managers finished net buyers.
Hedge funds finished net buyers.
Buying was driven by Tech and macro products.
TMT pad did not see especially chasey cash behavior.
However, demand for short-dated index upside was notable.
That distinction matters. The cash market is participating, but the real FOMO is showing up in derivatives.
5. Derivatives: FOMO on Full Display
The derivatives desk described the session as FOMO on full display. Clients chased the rally and rushed to add upside exposure.
Notable vol dynamics:
Spot up, vol up
Front-end fixed-strike vols rose more than 1 vol point
Skew was crushed across the board
Term structure flattened
Flows were heavily tilted toward index activity
Heavy short-dated S&P and Nasdaq upside buying
Large buyer of short-dated momentum upside in the morning
This is an important regime shift. Normally, in a calm rally, implied vol falls as spot rises. But today saw spot up / vol up, which indicates demand for upside convexity overwhelmed normal vol-supply dynamics.
That is classic FOMO behavior.
6. Dealer Gamma Setup Now Amplifies Upside
The dealer gamma picture has shifted meaningfully.
The desk estimates:
Dealers will get shorter gamma to the topside
Dealers are longer gamma to the immediate downside
That means the market structure now favors:
Rallies being exacerbated as dealers chase higher
Immediate selloffs being dampened as dealers buy dips
A tighter downside cushion near spot
Greater upside acceleration risk
This is the reverse of the prior setup where upside was capped and downside could be amplified.
Current dealer dynamic:
Clients Buy Short-Dated Calls→Dealers Short Upside Gamma→Dealers Buy as Spot Rises→Rally ExacerbationClients Buy Short-Dated Calls→Dealers Short Upside Gamma→Dealers Buy as Spot Rises→Rally Exacerbation
And on modest dips:
Dealers Longer Immediate Downside Gamma→Dealers Buy Weakness→Larger Selloff HarderDealers Longer Immediate Downside Gamma→Dealers Buy Weakness→Larger Selloff Harder
This supports the idea that the rally can continue near term, especially into earnings catalysts.
7. S&P Implied Move Through Friday
The S&P implied move through Friday is 1.03%.
From the S&P close of 7,736, that implies:
7,736×0.0103=79.77,736×0.0103=79.7
So the market is pricing a rough range through Friday of:
7,656 to 7,8167,656 to 7,816
Given the upside chase and dealer gamma profile, a break above the implied range is plausible if earnings continue to support. But the large move also means short-dated upside is becoming increasingly crowded.
8. Macro Helped: Crude Down, Yields Lower
The macro backdrop was supportive.
Crude
WTI fell 5.81% to US$75.68. That is important because recent crude volatility had been feeding inflation risk, Fed credibility concerns, and rate volatility.
Lower crude reduces:
Inflation fear
Terms-of-trade pressure
Fed hike risk
Long-end yield pressure
Equity risk premium
Rates
The US 10-year yield fell roughly 5.7bps to 4.6187%. Lower yields were especially supportive for TMT and long-duration equities.
The move in yields helped the rally broaden beyond just AI / semis.
Dollar
DXY was essentially flat at 99.89, meaning the equity rally was not mainly a dollar move. It was more about earnings, positioning, and rates relief.
9. Post-Bell Earnings: Mixed Again
After the close, earnings were mixed and could temper some of the enthusiasm in specific pockets.
AMD: -8%
AMD traded down despite a headline beat because gross margins were only “inline.” In this tape, AI hardware winners need to beat not just revenue, but margins / supply / pricing expectations.
The reaction shows that the market is still selective in semis after the momo unwind.
Key read-through:
AI demand may remain strong.
But valuation / margin expectations are high.
Inline gross margins are not enough after a sharp rebound.
PINS: -7%
Pinterest traded lower despite revenue acceleration:
2Q revenue accelerated 2 points to +17% y/y constant currency
Above the high end of guide
3Q revenue guide inline
Company emphasized AI as a business accelerant
The issue is likely that after a risk-on rebound, inline forward guidance is not enough for stocks with elevated expectations.
SPCX: -3%, volatile
SPCX was all over the place post-bell.
Subs inline around 12mn
AI revenue beat: US$2.561bn versus consensus around US$2.08bn
Call at 4:30pm ET
This is an important AI monetization print. The headline AI revenue beat is positive, but the stock reaction suggests investors may want more detail on margins, durability, capex intensity, and forward conversion.
10. Tactical Interpretation
What Is Bullish
S&P closed at a record high.
NDX up roughly 9% in four sessions.
Positioning has been dramatically cleaned up.
Strong Q2 earnings are being rewarded again.
Asset managers and hedge funds are net buyers.
Crude is sharply lower.
10-year yields are lower.
Dealers short upside gamma can amplify rallies.
Immediate downside may be cushioned by dealer positioning.
What Is Still Risky
FOMO is visible in short-dated upside.
Spot-up / vol-up is not a calm rally dynamic.
Skew crush suggests hedges are being abandoned quickly.
Large MOC sell imbalance shows supply still exists.
Cash activity was only moderate.
Post-bell AMD / PINS weakness shows selectivity remains.
The rally is becoming increasingly dependent on continued earnings validation.
A reversal in crude or yields could quickly challenge the move.
11. Updated Market Regime
The market appears to have shifted from:
Prior Regime
Momentum unwind
AI / semi de-grossing
Beat-and-fade earnings
Dealer upside cap
Downside convexity risk
Long-only buyer strike
To:
Current Regime
Cleaner positioning
Earnings rewarded
FOMO upside demand
Spot up / vol up
Dealer upside acceleration
Dips harder to extend near term
More two-way but bullish index tape
That is a meaningful improvement.
12. Key Levels
S&P Level | Significance |
|---|---|
7,816 | Upper end of implied move through Friday |
7,736 | Current close / record high |
7,656 | Lower end of implied move through Friday |
7,600 | Important reclaimed support |
7,480 | Prior major pivot, now reclaimed |
7,453 | Prior systematic trigger, now reclaimed |
7,400 | Former support / resistance, now well below |
The reclaim of 7,453 / 7,480 / 7,600 is technically important. Those levels were previously risk zones. Now they form support if the market pulls back.
Disclaimer: The material provided is for information purposes only and should not be considered as investment advice. The views, information, or opinions expressed in the text belong solely to the author, and not to the author’s employer, organization, committee or other group or individual or company.
Past performance is not indicative of future results.
High Risk Warning: CFDs are complex instruments and come with a high risk of losing money rapidly due to leverage. 69% and 73% of retail investor accounts lose money when trading CFDs with Tickmill UK Ltd and Tickmill Europe Ltd respectively. You should consider whether you understand how CFDs work and whether you can afford to take the high risk of losing your money.
Futures and Options: Trading futures and options on margin carries a high degree of risk and may result in losses exceeding your initial investment. These products are not suitable for all investors. Ensure you fully understand the risks and take appropriate care to manage your risk.
Patrick has been involved in the financial markets for well over a decade as a self-educated professional trader and money manager. Flitting between the roles of market commentator, analyst and mentor, Patrick has improved the technical skills and psychological stance of literally hundreds of traders – coaching them to become savvy market operators!