Gold Forecast: The Double Top Formation Underway?
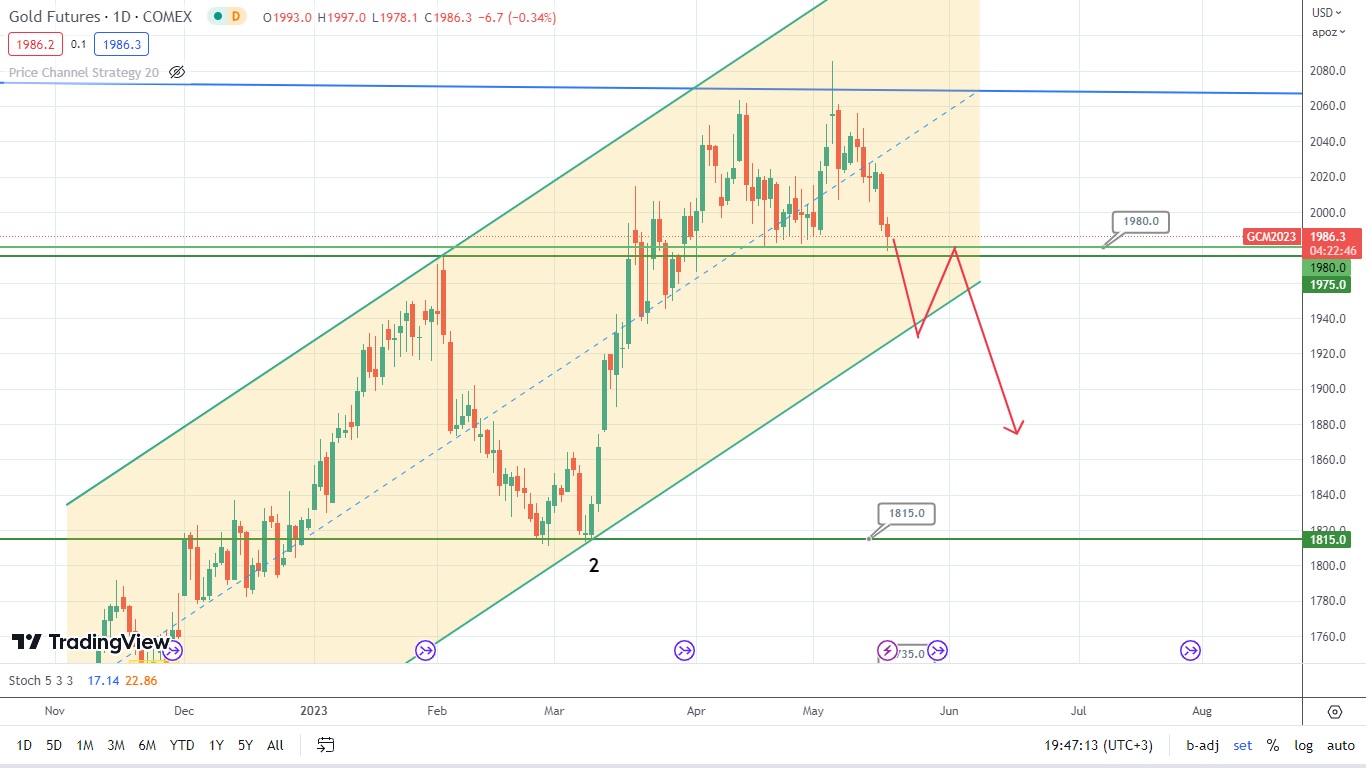
Gold has repeatedly approached the supporting level of 1980. This might signify the upcoming potential breakout of this level. The price drop might lead to the formation of a reversal pattern such as a double top with the neckline at the level of 1980. So, let’s wait and see what is next.

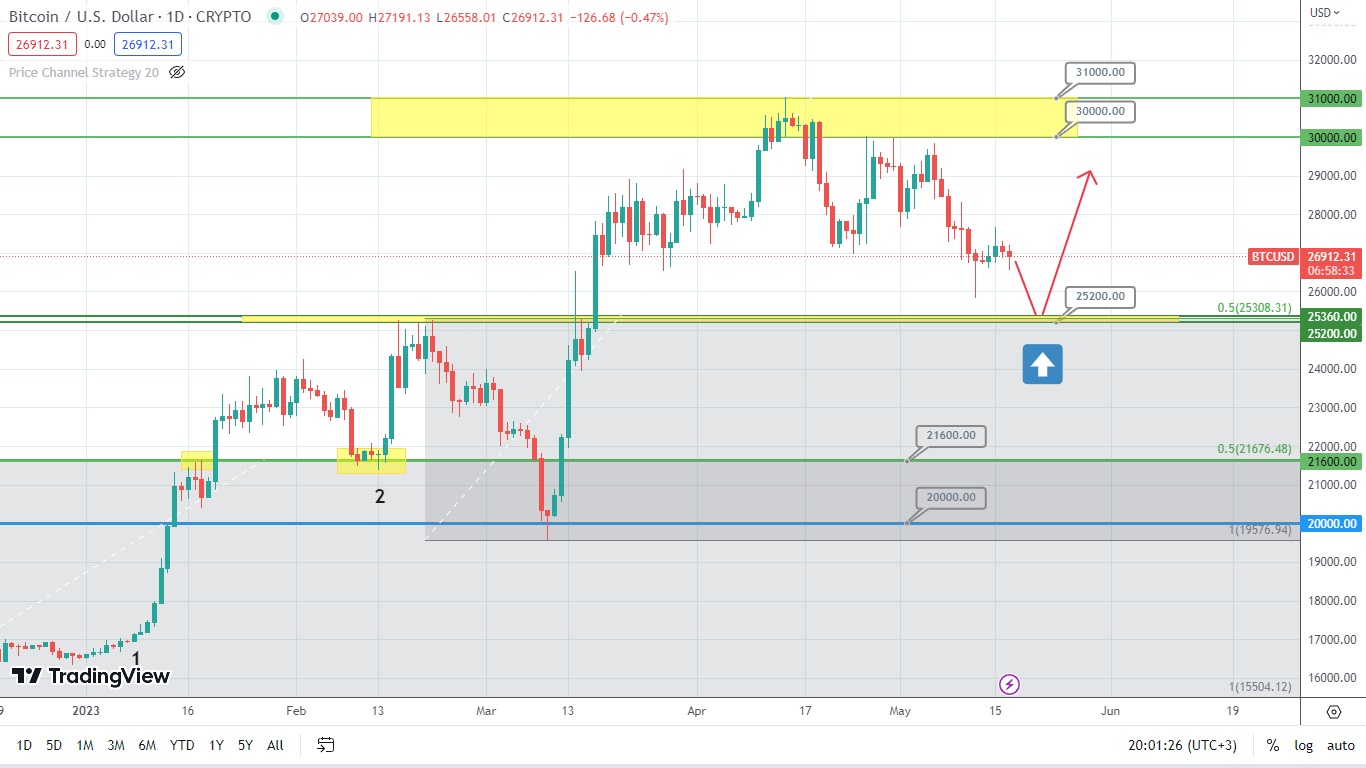
Bitcoin might still pull from the supporting level of 25200 and hit the level of 30000. However, the current drop should only be considered as a mere correction.
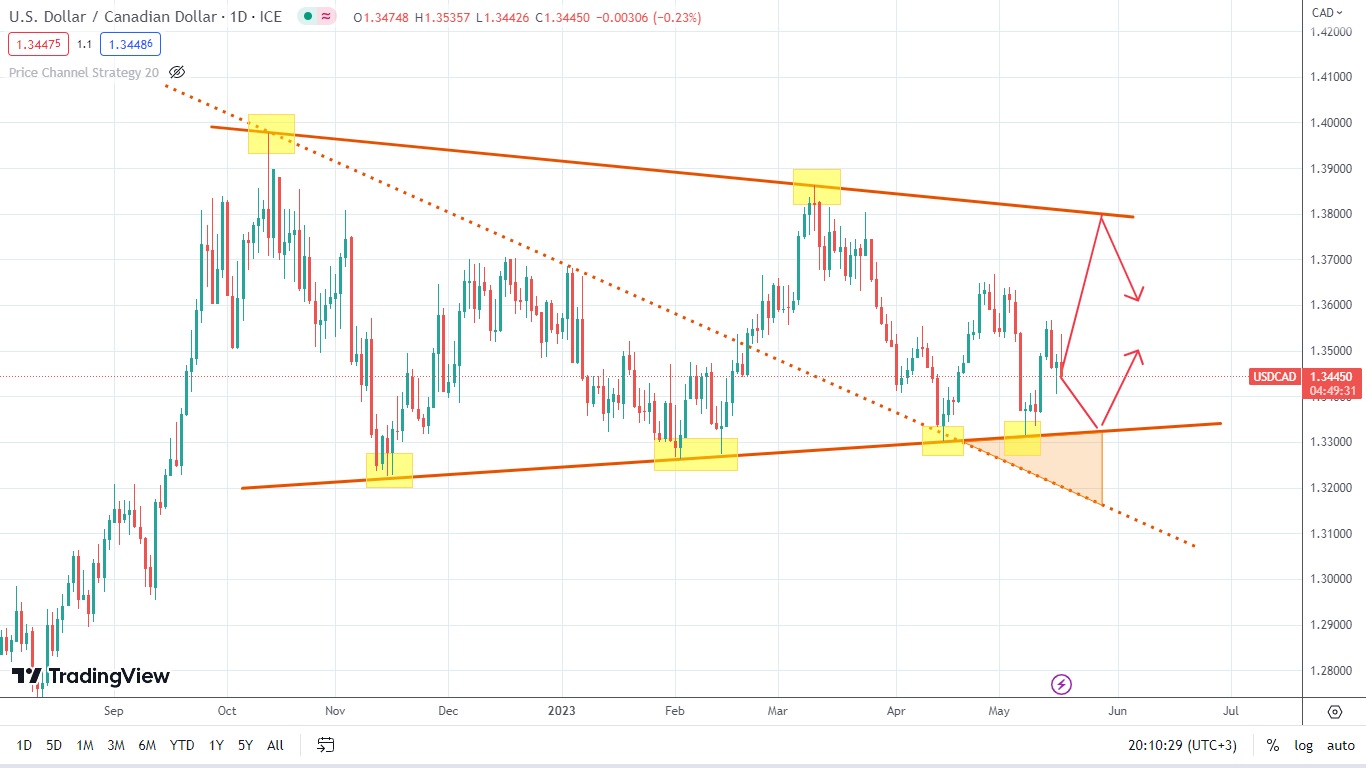
The price of the currency pair USD/CAD keeps moving inside a symmetrical triangle, targeting different sides. The Canadian dollar is likely to pull from one of the triangle sides inside of the pattern. At that, it would be wise to follow the candlestick formations as any of the triangle sides can get broken through at any given moment. Time will tell how this scenario is going to work out.
Отказ от ответственности: предоставленные материалы предназначены только для информационных целей и не должны рассматриваться как рекомендации по инвестициям. Точка зрения, информация или мнения, выраженные в тексте, принадлежат исключительно автору, а не работодателю автора, организации, комитету или другой группе, физическому лицу или компании.
Прошлые результаты не являются показателем будущих результатов.
Предупреждение о рисках: CFD-контракты – сложные инструменты, сопряженные с высокой степенью риска быстрой потери денег ввиду использования кредитного плеча. 71% и 74% розничных инвесторов теряют деньги на торговле CFD в рамках сотрудничества с Tickmill UK Ltd и Tickmill Europe Ltd соответственно. Вы должны оценить то, действительно ли Вы понимаете, как работают CFD-контракты, и сможете ли Вы взять на себя высокий риск потери своих денег.
Фьючерсы и опционы: торговля фьючерсами и опционами с маржей несет высокую степень риска и может привести к убыткам, превышающим ваши первоначальные инвестиции. Эти продукты подходят не для всех инвесторов. Убедитесь, что вы полностью понимаете риски и принимаете соответствующие меры для управления своими рисками.