S&P500 Daily Action Areas & Price Targets 17/9/2026

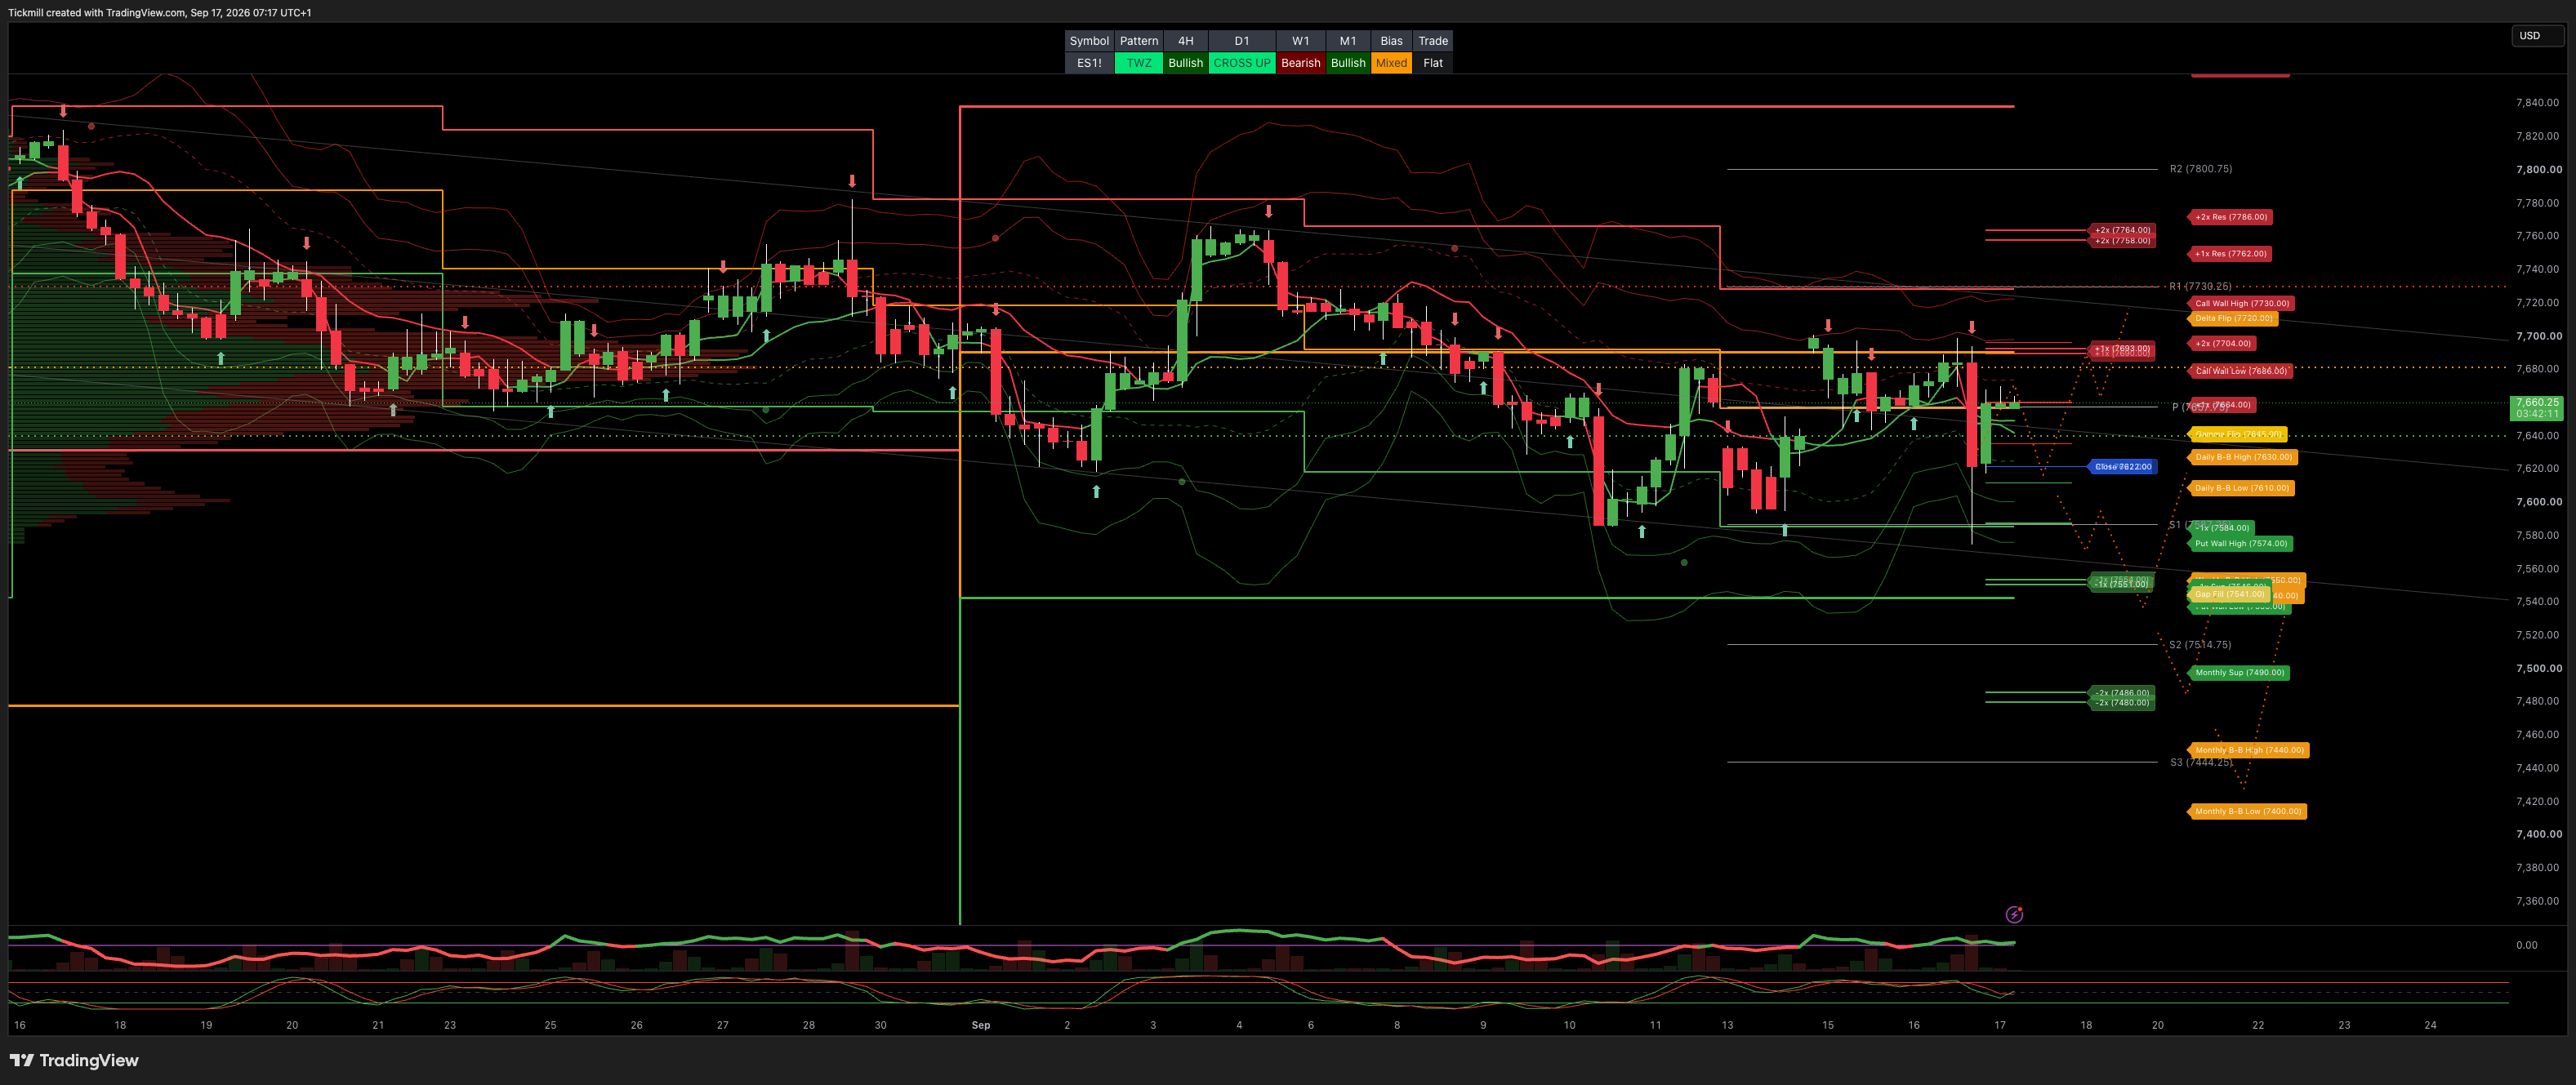
S&P500 Daily Action Areas & Price Targets 16/9/26
***QUOTING ES1!(Z CONTRACT LEVLES) FOR CASH US500 EQUIVALENT LEVELS, SUBTRACT POINT DIFFERENCE***
MONTHLY-WEEKLY& DAILY LEVELS
MONTHLY BULL BEAR ZONE 7440/7400
MONTHLY RANGE RES 7882 SUP 7490
WEEKLY BULL BEAR ZONE 7550/40
WEEKLY RANGE RES 7762/86 SUP 7538/46
DAILY BULL BEAR ZONE 7630/10
DAILY RANGE RES 7689 SUP 7550
2 SIGMA RES 7764 SUP 7479
GLOBEX RANGE SUP 7584 RES 7664
2 SIGMA RANGE SUP 7543 RES 7704
GAMMA FLIP 7645
DELTA FLIP 7720
PUT WALLS 7574/ 7533
CALL WALLS 7730 / 7686
UNFILLED GAPS 7541
DAILY STRUCTURE - OTFL ‘ 7699
WEEKLY STRUCTURE - OTFL - 7717
MONTHLY STRUCTURE - OTFH - 7542
VIX BULL BEAR ZONE 17.7 (VVIX / VIX) 5.39 sits within the historical norm (typically ranging between 5 and 7), suggesting moderate tension building without extreme panic
PRIMARY TRADES & TARGETS
LONG ON REJECT/RECLAIM DBBZ TARGET DAILY RANGE RES
LONG ON REJECT/RECLAIM WBBZ TARGET RTHCLOSE
***ADDITIONAL SETUPS & TARGETS HIGHLIGHTED ON THE CHARTS***
(I FADE TESTS OF 2 SIGMA LEVELS ESPECIALLY INTO THE FINAL HOUR OF THE NY CASH SESSION AS 90% OF THE TIME WHEN TESTED THE MARKET WILL CLOSE ABOVE OR BELOW THESE LEVELS)
SPX PUT/CALL RATIO 1.28(The numbers reflect options traded during the current session.) A put-call ratio below 0.7 is generally considered bullish, and a put-call ratio above 1.0 is generally considered bearish.
JHEQX Q3 Collar Short Call Cap: ~7,750 – 7,900 - Long Put Strike: ~7,050 – 7,100 (approx. 5% downside protection) Short Put Strike: ~5,950
DEC2025 OPEX to DEC2026 OPEX is 945 points giving us a range of [5889,7779]
Notes On Structure Implications
Balance: This refers to a market condition where prices move within a defined range, reflecting uncertainty as participants await further market-generated information. Our approach to balance includes favouring fade trades at the range extremes (highs/lows) while preparing for potential breakout scenarios if the balance shifts.
One-Time Framing Higher (OTFH): This represents a market trend where each successive bar forms a higher low, signalling a strong and consistent upward movement.
One-Time Framing Lower (OTFL): This describes a market trend where each successive bar forms a lower high, indicating a pronounced and steady downward movement.
GOLDMAN SACHS FICC & EQUITY TRADING DESK VIEWS
THE TAKE: HAWKISH DOT PLOT EXTENDS EQUITY LOSSES AS CURVE FLATTENS
US equity benchmarks closed lower for a third consecutive session after an intraday post-FOMC rally faded. As expected, the Federal Reserve raised rates by 25 bps to a target range of 3.75%–4.00% with no dissents. However, the accompanying Summary of Economic Projections (SEP) delivered a distinctly hawkish message:
2026 Dot Plot: Signals one additional rate hike later this year (median of 2 hikes total in 2026). Distribution: 2 participants favor only today's hike, 4 favor 3 hikes total, and the majority see 2 hikes.
2027 Path: Projects zero rate cuts in 2027, with 8 participants modeling a 4.25%–4.50% policy rate by year-end 2027.
Inflation Upgrade: Year-end 2026 Core PCE forecast was revised up to 3.4%, indicating officials see limited downside relief from upcoming methodological recalculations.
WTI Crude dropped -3.52% to $102.10/bbl on reports of progress regarding Saudi Arabia's East-West pipeline, though Middle East geopolitical uncertainty remains an overhang. Meanwhile, the US 10-Year yield pushed higher to 5.0205%, and the US Dollar Index (DXY) jumped +69 bps to 100.30.
MARKET SUMMARY & ASSET BREAKDOWN
S&P 500 (SPX): Closed at 7,551.00 (-0.45%) | VIX up +2.97% to 17.71 | MOC $1.25B to SELL | Remaining weekly straddle priced at 1.07%
Nasdaq-100 (NDX): Closed at 28,945.00 (+0.03%) | Outperformed broader tape on profitable AI hardware bid
Russell 2000 (RUT): Closed at 2,858.00 (-0.40%) | Small-caps remain under pressure from sustained 5%+ long-end yields
Dow Jones (DJI): Closed at 51,461.00 (-1.21%) | Underperformed due to heavy drag from cyclical value and dividend names
US 10-Year Treasury: Yield at 5.0205% (+1.9 bps) | Holds above 5.0% as hawkish SEP reinforces curve-flattening bias
WTI Crude: Price at $102.10 (-3.52%) | Gave back gains on East-West pipeline headlines; Hormuz/Iran risks remain
Gold: Price at $4,265.00 (-0.63%) | Pulled back under pressure from a stronger USD (DXY 100.30) and higher real rates
Bitcoin: Price at $76,283.00 (+0.53%) | Stabilized alongside tech megacaps
CBOE VIX: Closed at 17.71 (+2.97%) | Fixed strike vol relaxed post-event as panic failed to materialize
AI COMPLEX BIFURCATION & FACTOR ROTATION
The AI sector reversed yesterday's software-led move, displaying a sharp split between profitable, duration-backed hardware vs. speculative productivity plays:
Data Centers & Infrastructure (
GSTMTDAT): +1.28% | Caught a strong bid as capital expenditure commitments remain firm.AI Semiconductors (
GSCBSMHX): +0.89% | Rebounded alongside core hardware names.Software At Risk (
GSTMTSOS): -1.83% | Sold off as high-multiple duration software faced renewed rate pressure.AI Productivity Basket (
GSXUPROD): -2.19% | Weakness concentrated in speculative execution plays.
GS RATES STRATEGY & DERIVATIVES COLOR
Rates Strategy Take (Will Marshall): While hawkish relative to baseline expectations, the median dots and SEP core PCE print (3.4%) reflect a vigilant, inflation-focused Fed. The breadth of support for another hike this year and 8 projections for a 4.25%–4.50% rate in 2027 should preserve the recent yield curve flattening.
Vol & Desk Flows (Shayna Peart):
Vol Surface: VIX expiry cleared quietly in the morning (1m variance settled at 16.79). Fixed strike vols relaxed post-announcement as the market failed to realize the downside straddle.
Option Positioning: Sizable buying in IWM end-of-month upside calls and GLD call spreads (Sep to Jan tenors), playing both immediate FOMC volatility and a longer-dated breakout.
Dealer Gamma: Heavy concentration of dealer long gamma to the topside remains intact, creating a resistance ceiling for breakout rallies without major geopolitical de-escalation.
Institutional Desk Activity (4/10 Rating):
Asset Managers (LOs): Net sellers of -$829M (supply in macro products and tech vs. light demand in Comm Services and Discretionary).
Hedge Funds: Small net buyers overall (demand in Tech, Discretionary, Comm Services, and Staples vs. short supply in macro products and Financials).
Disclaimer: The material provided is for information purposes only and should not be considered as investment advice. The views, information, or opinions expressed in the text belong solely to the author, and not to the author’s employer, organization, committee or other group or individual or company.
Past performance is not indicative of future results.
High Risk Warning: CFDs are complex instruments and come with a high risk of losing money rapidly due to leverage. 69% and 73% of retail investor accounts lose money when trading CFDs with Tickmill UK Ltd and Tickmill Europe Ltd respectively. You should consider whether you understand how CFDs work and whether you can afford to take the high risk of losing your money.
Futures and Options: Trading futures and options on margin carries a high degree of risk and may result in losses exceeding your initial investment. These products are not suitable for all investors. Ensure you fully understand the risks and take appropriate care to manage your risk.
Patrick has been involved in the financial markets for well over a decade as a self-educated professional trader and money manager. Flitting between the roles of market commentator, analyst and mentor, Patrick has improved the technical skills and psychological stance of literally hundreds of traders – coaching them to become savvy market operators!